On Thursday I mentioned I was waiting for Bentek's estimate of production in the EIA's weekly natural gas report:
...Bentek Energy reported dry gas production this week averaged 64.7 Bcf/d, up nearly 2% from a year ago....
Here's the other side of the coin, from RBN Energy:
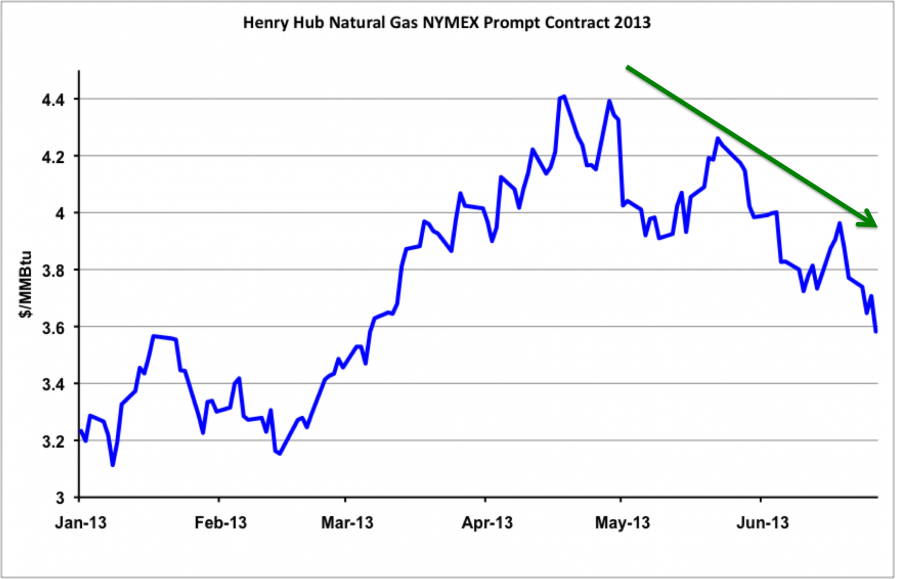
NYMEX natural gas prices have fallen 16 percent since reaching their high for the year so far of $4.408/MMBtu on April 19, 2013. The NYMEX August contract closed at $3.582/MMBtu on June 27, 2013.The market is currently in the low demand shoulder season. Winter is over and summer heat is on the way but temperatures in May and June are not typically high enough to significantly increase demand for air conditioning. Today we review shoulder season gas market fundamentals.The futures appear to be bottoming (for now). Here's the 5-minute chart from FinViz:
There are two “shoulder” seasons in the gas year. These are the periods when demand for gas is at its lowest. The term derives from the fact that demand either side of the winter peak has a shoulder pattern - coming down in the spring when temperatures increase and going up in the fall when temperatures cool down. The right shoulder is the period after winter and before the height of summer – that’s where we are right now. The left shoulder comes in the fall. When we last reviewed natural gas fundamentals at the start of April we noted that prices had increased by 25 percent since the start of 2013 (see Spring is in the Air). Since the end of April – during the shoulder season - prices have been falling as temperatures have warmed.
Source: CME Futures Data from Morningstar (Click to Enlarge)The chart above shows settlement prices for the natural gas nearby futures contract so far this year (2013). After a relatively mild start to the winter in January and February, prices shot up in March and April in response to a late winter cold spell. The increased demand for residential and commercial space heating during the cold spell helped to pull more gas out of storage. However, after reaching a high of $4.40/MMBtu in April, NYMEX gas prices retreated in the face of lower demand from power generation – forming the downward “right” shoulder typical in May and June (green arrow on the chart). In 2012 that downward pattern never happened because gas prices fell so low in April last year that they attracted more system operators to use gas fired generation. That power burn kept prices from falling any lower during the May and June 2012 shoulder months. This year rising prices for natural gas since February meant power system operators switched back to coal powered generation (see Summer Power Burn). In the absence of additional demand from power burn, prices have been weaker since the end of April and storage injections have increased. Although storage injections are expected during the shoulder seasons because demand is low, too much storage build up early in the year can weigh heavily on market prices....MUCH MORE