Where are you sending it and how are you transporting it:
From RBN Energy:
Netback, Netback to Where You Started From – Bakken Crude Logistics Favor Pipeline Over Rail
The West Texas Intermediate (WTI) discount to Brent narrowed 80 percent since February 2013 to close at $4.05 on Monday July 8, 2013. As a result the netbacks that crude producers in North Dakota receive for barrels sent to the East Coast has tumbled and they can now make more money sending crude to market on the pipeline route to Cushing. Today we run the numbers on changing Bakken netbacks.
Yesterday we covered the sharp narrowing of the WTI discount to Brent in the past couple of weeks (see Reunited). We have previously discussed the impact of the narrower spread between West Texas Intermediate (WTI) and Brent on the overall crude by rail business (see Last Train to Bakkenville). Today we look at the consequences of recent changes in the spread on transport to market options for Bakken crude producers in North Dakota. We should note that this analysis does not take account of any impact from the terrible rail derailment in Quebec last weekend – that could have wider implications for crude by rail transportation.
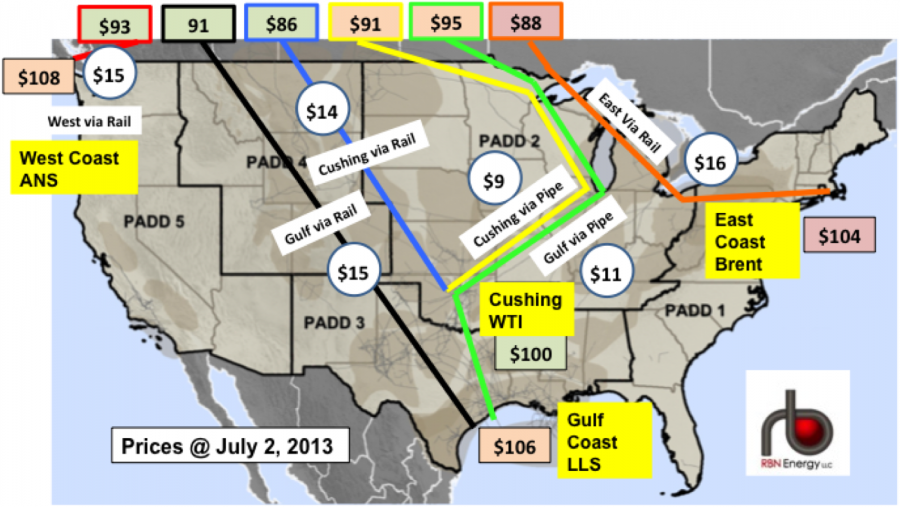
We start by making a comparison between the netbacks that Bakken producers could achieve on March 1, 2013 and the equivalent return last week on July 2nd after the WTI discount to Brent narrowed below $5/Bbl. We discussed the netback calculation that estimates where a producer can get the best return on crude based on transport costs and destination prices in a previous blog (see Brent WTI and the Impact on Bakken Netbacks). The following two map representations illustrate the impact of changing crude differentials on these Bakken producer netbacks since March 2013....
...The transport costs indicated in circles on the maps are based on a number of industry presentations as well as published pipeline tariffs and estimates of rail car leases. These costs include all transportation from the wellhead to the refining region and are by their nature representative rather than actual. The yellow text boxes indicate the market region and the adjacent box with a $/Bbl number is the prevailing benchmark crude price. Our assumption for this analysis is that producers would realize the regional benchmark price for crudes. In reality the actual prices received for North Dakota crudes in these markets are likely to be discounted by $1-$2/Bbl to make Bakken more attractive to regional refiners. The different colored boxes at the top and the matching colored lines on the map “connect the dots” for each available mode of transport and destination. The numbers in the boxes at the top are the netbacks – the benchmark prices, less the transport costs for that particular route....MORE