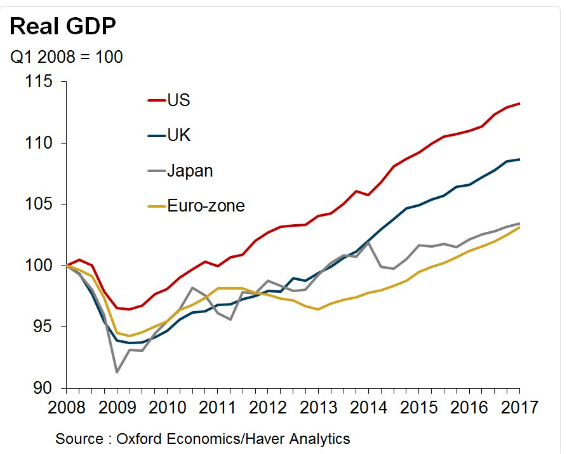
This Great Graphic was tweeted by Martin Beck, and it comes from Oxford Economics, using Haver Analytics database. It shows the relative economic growth since 2008 for the US, UK, Japan, and EMU.And:
It will not surprise many to learn that US contraction was not as deep as in the areas. It also would not be surprising to learn that the US economy has grown the most since 2008. This is part of the material basis for the divergence of monetary policy and the third significant dollar rally since the end of Bretton Woods.
On the other hand, many might suspect Japan has been the worst of the bunch, but in truth, it is the eurozone that has been the laggard. However, that is about to change. Real GDP growth in the eurozone is about to overtake Japan.
Controversy has emerged over the outlook for the US and UK monetary policy. There is nothing in the red line depicting the US, which suggests the eight-year recovery is about to end. There are no significant imbalances. While the Fed has hiked, the real Fed funds and two-year note yields are still negative. The Fed has not tightened so much as removed some accommodation. The US economy slowed from 3.5% in Q316 to 2.1% in Q4 and then 1.2% in Q1 17. However, the slowdown is likely behind the US as GDP appears to have accelerated in Q2.
After being widely criticized for being too dovish, the Federal Reserve has become subject to widespread criticism that is was too hawkish last week in announcing a rate hike and details of its unwinding of QE. Some argue the economy is slowing, but this assessment is made by looking at the rear-view mirror. The Fed does not target GDP. Its mandate is full employment, and that has been approached. It has a mandate for price stability. Inflation has softened in recent month, but Yellen and the Fed's leadership wants to look through it as it has been primarily driven by the fall in energy prices and wireless communication. There are some other quirky things, dragging down core inflation, like owner equivalent rent (falling while rents are rising). The prices received from the Philly, and NY Fed surveys reached new five-year highs.
Underneath Yellen and Dudley's recent comments is a faith in the Phillip's curve, which essentially asserts that businesses will raises prices to offset rising labor costs. This is a debatable point. Is labor really simply another input, like raw materials? Some argue that wages did not fall as much as the economic conditions would have suggested during the crisis given the slack and deflationary conditions. Others argue that wages should be rising faster now, even though they are growing faster than productivity. In any event, as long as the labor market is absorbing its slack, at least some Fed officials will be confident that price pressures will rise even if there are unpredictable lag times....MORE
Great Graphic: Fed, ECB, and BOJ Balance Sheets
This Great Graphic composed on Bloomberg shows the balance sheets of the Federal Reserve, the European Central Bank, and the Bank of Japan as a proportion of GDP.
The Federal Reserve 's balance sheet (as a fraction of GDP) is depicted in the green line. The primary reason it has drifted lower in the past few years is that the denominator, that is GDP has grown. Going forward, we suspect starting in October (announcement in September) the balance sheet itself will begin slowly shrinking in absolute terms not just as proportion of GDP. That means that the slight downtrend in the green line will become more pronounced.
The yellow line is the ECB's balance sheet. Early in the European crisis, the ECB's balance sheet expanded (see 2011-2012), but then it fell back. It drifted lower in 2013-2014 and began growing again with under Draghi's leadership. As a percentage of GDP, the ECB's balance sheet is larger than the Fed's ever was, and it has not peaked. The balance sheet continues to grow faster than the eurozone economy. We suspect that in September the ECB will announce that starting next year, it will slow its asset purchases, but extend them through H1 2018....MORE